
Imagine running a factory without knowing the vital signs of your production line. It's like driving a car without a dashboard—speed, fuel, and engine performance all become a guessing game. In the complex world of manufacturing, keeping an eye on the right metrics can be the difference between a thriving business and a struggling one.

Just as a car's dashboard provides essential information, manufacturing metrics help businesses identify areas for improvement, monitor performance, and drive continuous growth. With the right data in hand, you can navigate your way to a more efficient, cost-effective, and profitable operation.
In this blog, we'll explore the 15 most important metrics in manufacturing that will empower you to steer your business toward success. Get ready to rev up your manufacturing engine and shift gears toward a brighter future.
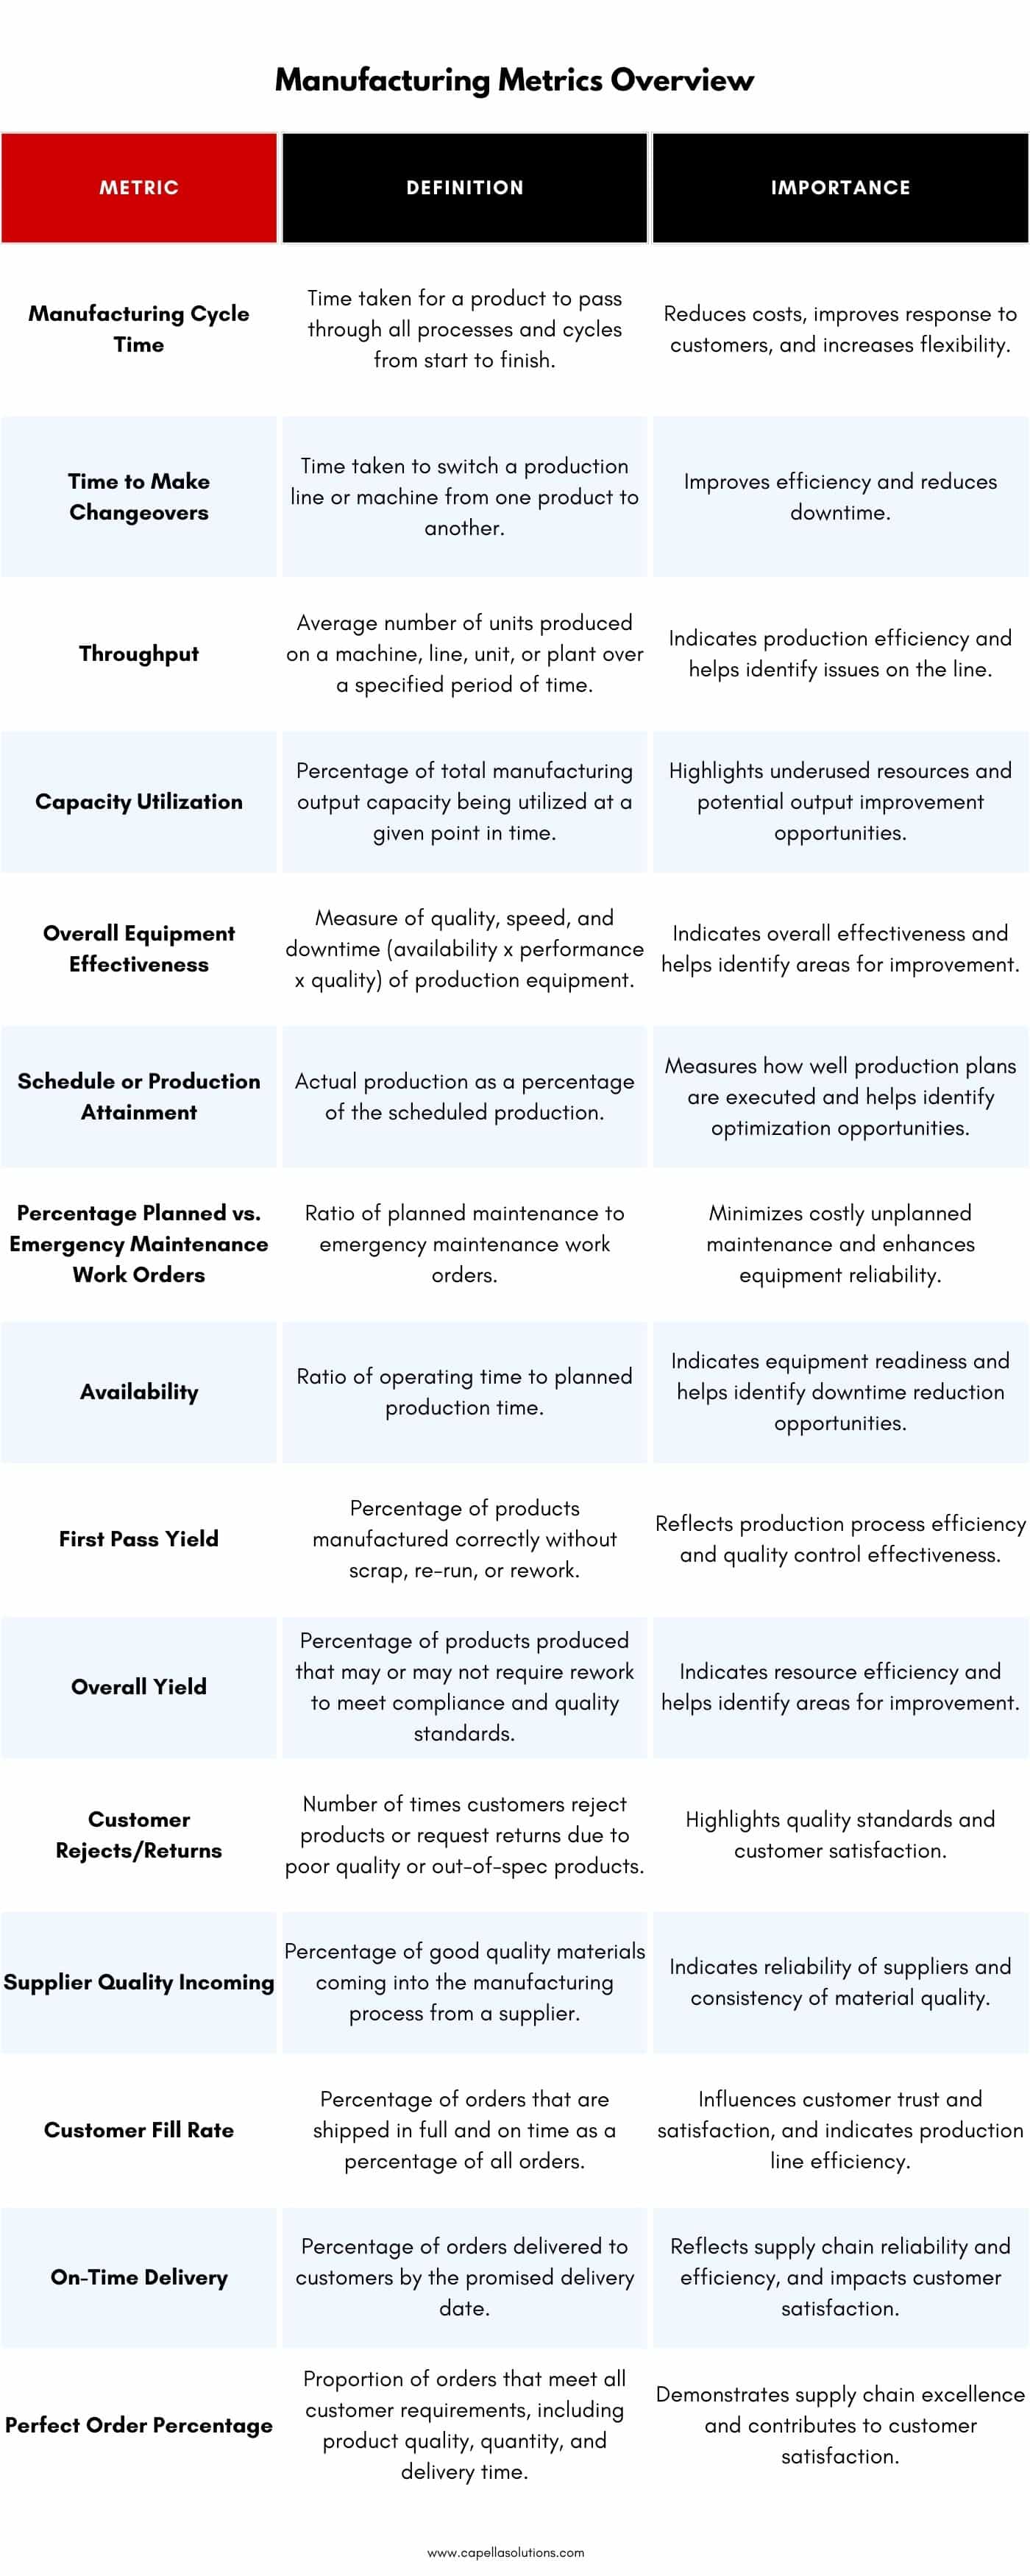
1. Manufacturing Cycle Time:

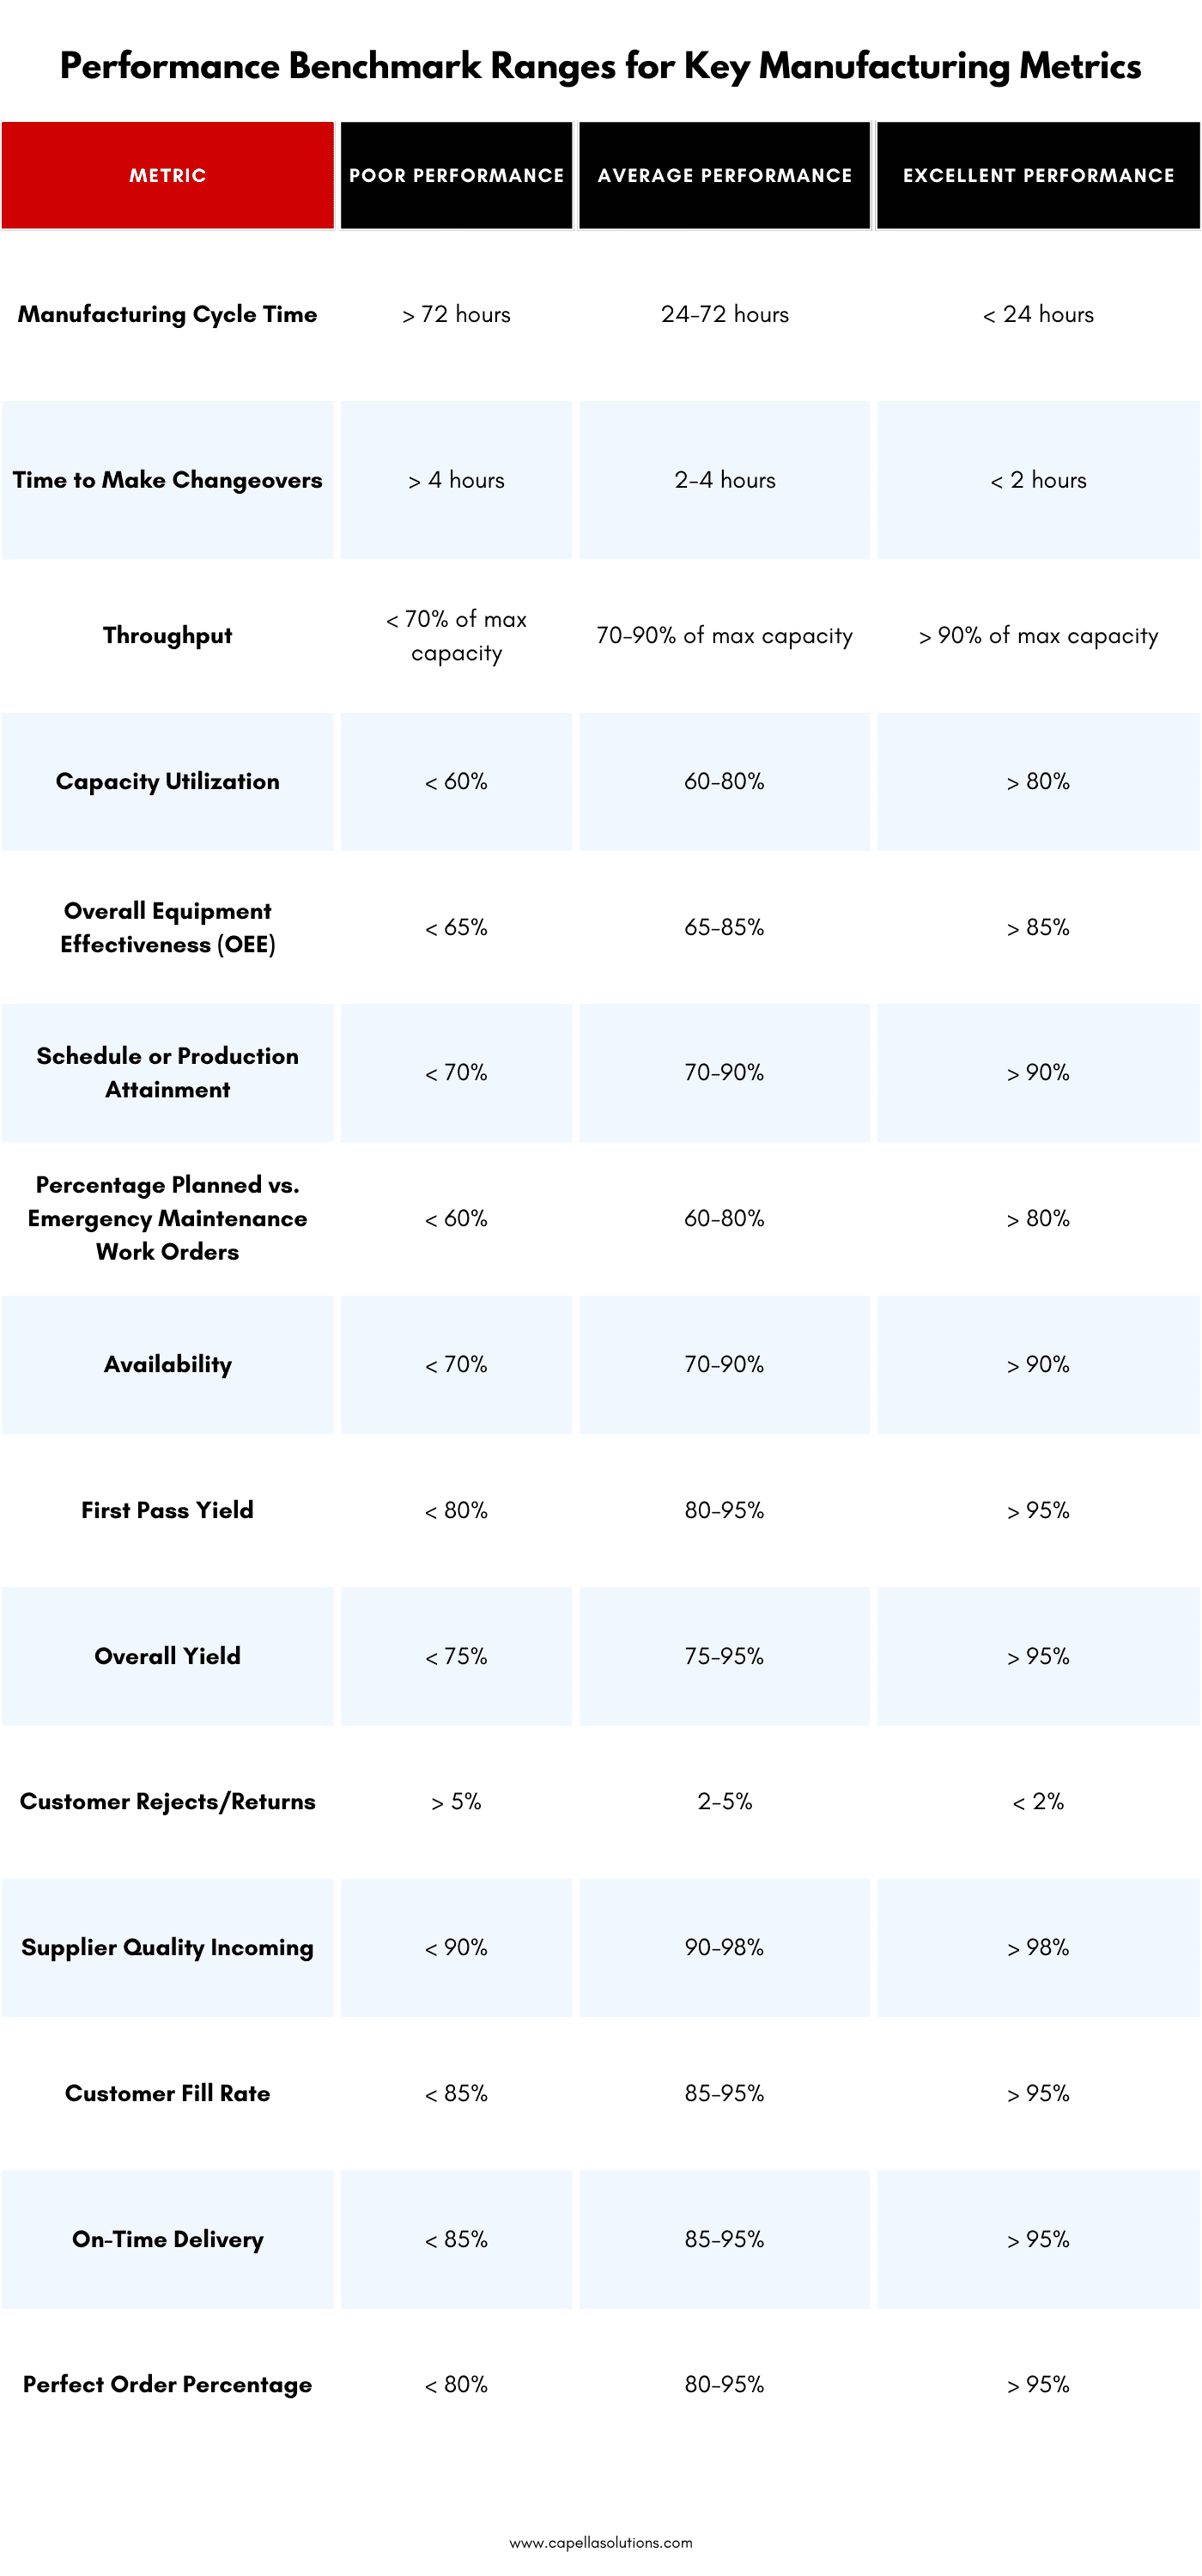
This metric measures the time it takes for a product to pass through all stages of the manufacturing process, from order release to completion. For example, if it takes 10 hours for a furniture manufacturer to process raw materials into a finished chair, the manufacturing cycle time is 10 hours. Reducing cycle time can lead to reduced costs, better response to customers, and increased flexibility. Techniques to reduce cycle time include streamlining processes, eliminating waste, and investing in automation.
2. Time to Make Changeovers:

Changeover time measures the duration required to convert a production line or machine from running one product to another. For instance, if a bakery needs to switch from making croissants to baguettes, the time spent cleaning, adjusting equipment, and preparing new ingredients is the changeover time. Monitoring this metric allows you to identify areas for improvement, such as using equipment that is easier to set up and configure, implementing standardized work instructions, or employing quick changeover techniques like Single-Minute Exchange of Die (SMED).
3. Throughput:

Throughput quantifies the average number of units produced on a machine, line, unit, or plant over a specified period, such as units per hour. If a beverage company can produce 1,000 bottles per hour, its throughput is 1,000 units/hour. Tracking throughput helps identify production bottlenecks and areas for improvement. Techniques to increase throughput include optimizing equipment settings, investing in automation, implementing lean processes, and improving workforce skills.
4. Capacity Utilization:

This metric indicates the percentage of total manufacturing output capacity being utilized at a given point in time. For example, if a factory can produce a maximum of 5,000 units per day but only produces 4,000 units, its capacity utilization is 80%. Monitoring capacity utilization helps identify underutilized resources and opportunities for improvement. Strategies to increase capacity utilization include adjusting production schedules, reallocating resources, and reducing downtime.
5. Overall Equipment Effectiveness (OEE):

OEE is a globally recognized best practice measure and key performance indicator that assesses the efficiency and productivity of production equipment or entire production lines. It takes into account availability, performance, and quality. For example, a high OEE score indicates that a car assembly line is producing high-quality vehicles quickly with minimal downtime. Improving OEE can lead to increased profitability and cost-effectiveness. Techniques for enhancing OEE include preventive maintenance, employee training, and process optimization.
6. Schedule or Production Attainment:

This metric measures the percentage of actual production compared to the scheduled production within a set time. For instance, if a textile manufacturer plans to produce 500 units in a day but only produces 450 units, its production attainment score is 90%. Low percentages may indicate suboptimal machine settings or poor production planning. Strategies to improve schedule attainment include better demand forecasting, optimizing production planning, and enhancing communication between departments.
7. Percentage Planned vs. Emergency Maintenance Work Orders:

Planned Maintenance Percentage (PMP) shows the proportion of maintenance hours spent on planned activities in a given time period. For example, if a company spends 300 hours on planned maintenance and 100 hours on emergency maintenance in a month, the PMP is 75%. The goal is to minimize unplanned work, as it can cost significantly more due to rushed parts, service callouts, downtime, and overtime. Strategies to improve PMP include implementing a preventive maintenance program, tracking equipment performance, and investing in predictive maintenance technologies.
8. Availability:
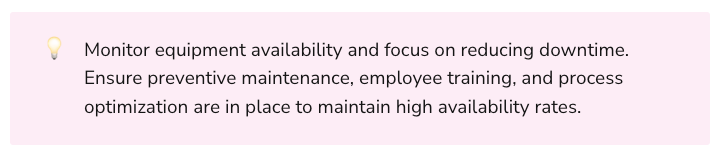
This metric is the ratio of operating time to planned production time. Operating time is calculated by subtracting downtime (any period when production is stopped) from the planned production time. For example, if a factory has a planned production time of 10 hours and experiences 1 hour of downtime, its availability is 90%. High availability indicates that production equipment is consistently ready for use. To improve availability, focus on reducing downtime through preventive maintenance, employee training, and process optimization.
9. First Pass Yield:

First Pass Yield (FPY) is the percentage of products manufactured correctly and to specifications the first time, without scrap, re-run, or rework. For example, if a smartphone manufacturer produces 900 defect-free units out of 1,000, its FPY is 90%. High FPY values indicate efficient and effective production processes. To improve FPY, focus on enhancing quality control, standardizing work instructions, and investing in employee training.
10. Overall Yield:

Overall Yield is the percentage of products produced that may or may not require rework to meet compliance and quality standards. High overall yield rates signify that fewer resources are wasted on rework and scrap. Strategies to improve overall yield include implementing robust quality management systems, optimizing production processes, and improving supply chain management.
11. Customer Rejects/Returns:
This metric tracks the number of times customers reject products or request returns due to poor quality or out-of-specification products. For example, if an electronics manufacturer receives 50 returns out of 1,000 products sold, its customer rejects/returns rate is 5%. Low rates indicate high quality standards. To reduce customer rejects/returns, focus on improving product design, implementing stringent quality control measures, and addressing customer feedback.
12. Supplier Quality Incoming:
Measuring supplier quality is critical in determining a product's final quality. This metric is the percentage of good quality materials coming into the manufacturing process from a supplier. For example, if a car manufacturer receives 950 high-quality components out of 1,000, its supplier quality incoming rate is 95%. High rates indicate reliable suppliers and consistent material quality. To improve supplier quality, establish strong supplier relationships, implement supplier performance metrics, and conduct regular supplier audits.
13. Customer Fill Rate:

Customer fill rate measures the percentage of orders that are shipped in full and on time as a proportion of all orders. For instance, if a retailer receives 980 complete orders out of 1,000 on time, its customer fill rate is 98%. High fill rates contribute to customer satisfaction and trust. To improve customer fill rates, optimize inventory management, streamline order processing, and enhance communication with customers.
14. On-Time Delivery:

On-time delivery is the percentage of orders delivered to customers by the promised delivery date. For example, if a furniture manufacturer delivers 900 out of 1,000 orders on time, its on-time delivery rate is 90%. High on-time delivery rates indicate a reliable and efficient supply chain. Strategies to improve on-time delivery include better demand forecasting, optimizing transportation routes, and investing in real-time tracking technology.
15. Perfect Order Percentage:

Perfect Order Percentage (POP) is the proportion of orders that meet all customer requirements, including product quality, quantity, and delivery time. For instance, if a pharmaceutical company fulfills 975 out of 1,000 orders flawlessly, its POP is 97.5%. High POP rates demonstrate supply chain excellence and contribute to customer satisfaction. To improve POP, focus on enhancing end-to-end supply chain visibility, implementing robust quality management systems, and fostering a culture of continuous improvement.
Consistently tracking and analyzing these 15 crucial manufacturing metrics can provide valuable insights into your manufacturing processes, pinpoint areas for improvement, and drive overall business success.
By investing time and resources into collecting, managing, and acting on these metrics, you can unlock the full potential of your manufacturing operations and fuel sustainable growth. Remember, knowledge is power—stay informed and make data-driven decisions to stay ahead of the competition.

1. Why are manufacturing metrics important?
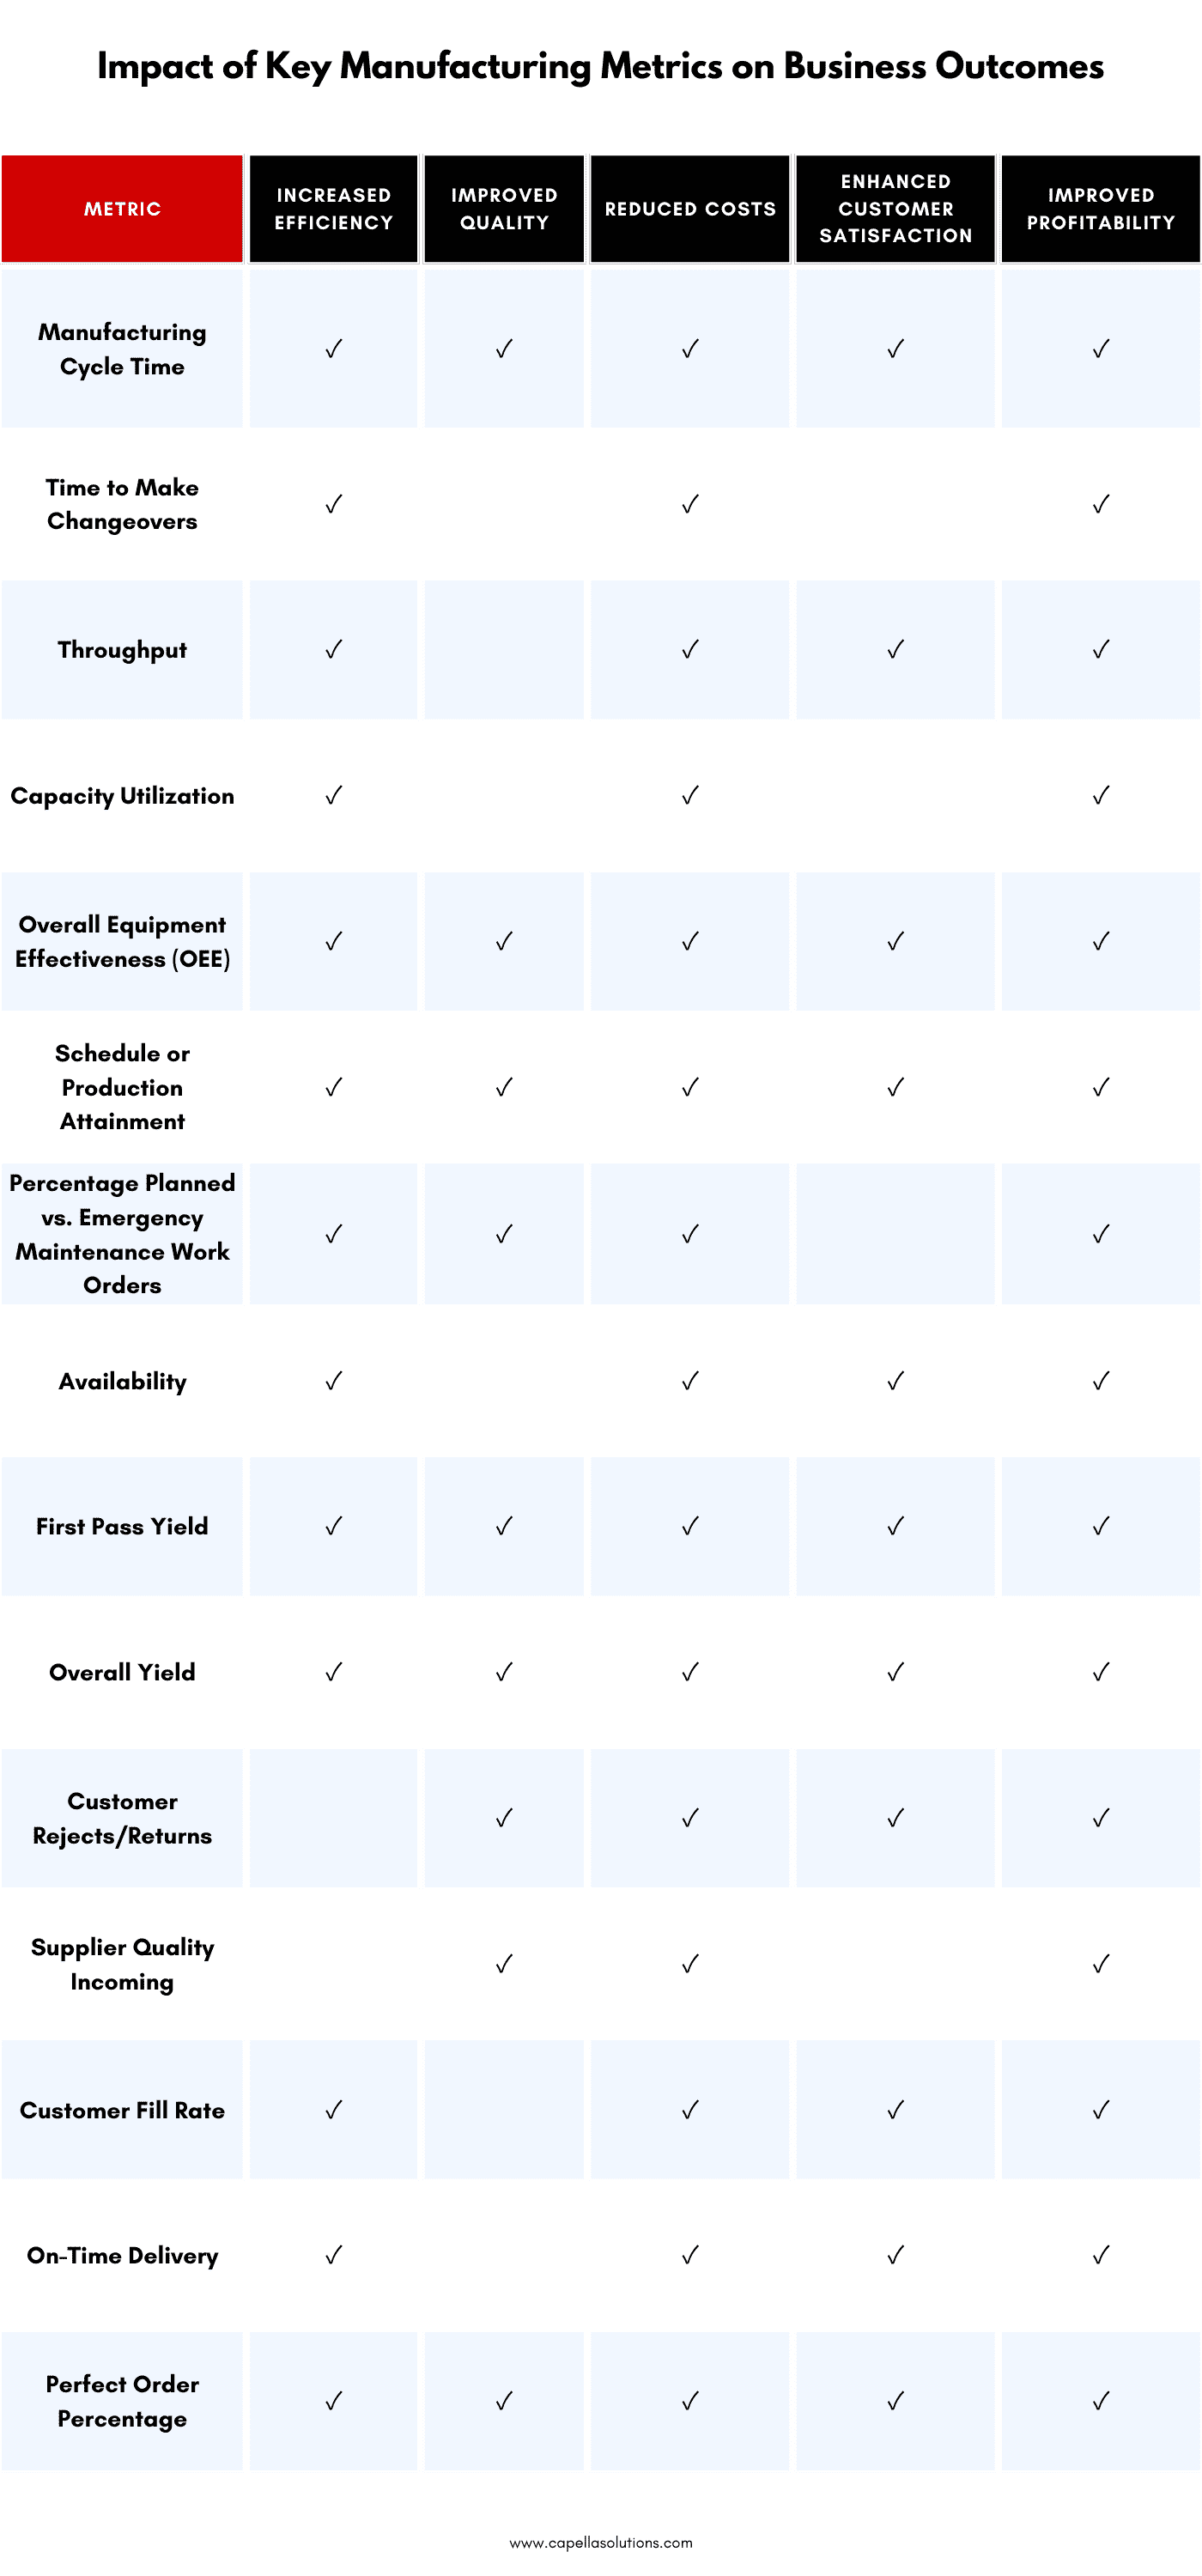
Manufacturing metrics are crucial because they help businesses identify areas for improvement, monitor performance, optimize processes, and drive continuous growth. By collecting and analyzing relevant data, companies can pinpoint weaknesses in their production line and make informed decisions to enhance efficiency, quality, customer satisfaction, and profitability.
2. What is the significance of Manufacturing Cycle Time in manufacturing metrics?
Manufacturing Cycle Time measures the total time taken for a product to pass through all machines, processes, and cycles to become a finished product. By analyzing this metric, businesses can identify bottlenecks in their production line and implement strategies to reduce cycle time. Lower cycle times lead to reduced costs, better customer response, and increased flexibility in manufacturing operations.
3. How can I improve my factory's Time to Make Changeovers?
Improving the Time to Make Changeovers involves analyzing the current changeover times and identifying areas for improvement. Strategies may include:
- Streamlining processes and implementing standardized procedures
- Investing in equipment with faster setup times or quick-change features
- Training employees on best practices for efficient changeovers
- Utilizing lean methodologies, such as Single-Minute Exchange of Die (SMED), to optimize changeover processes
4. What is Overall Equipment Effectiveness (OEE), and why is it important?
OEE is a comprehensive metric that assesses the efficiency and productivity of production equipment or entire production lines. It evaluates three factors: availability, performance, and quality. A higher OEE score indicates that the manufacturing process is more profitable and cost-effective. By measuring and improving OEE, businesses can optimize equipment utilization, reduce waste, and enhance product quality.
5. How can I improve my facility's Schedule or Production Attainment score?
Improving your facility's Schedule or Production Attainment score involves several steps:
- Enhancing demand forecasting accuracy to improve production planning
- Implementing better communication between departments to adapt to real-life changes quickly
- Optimizing machine settings and calibrations to reduce downtime
- Providing employee training to ensure adherence to production schedules
6. How can I minimize emergency maintenance work orders?
To minimize emergency maintenance work orders, focus on implementing preventive and predictive maintenance programs. This involves regular inspections, scheduled maintenance activities, and monitoring equipment conditions. By proactively addressing potential issues, you can reduce the likelihood of unexpected equipment failures and associated costs.
7. What steps can I take to improve my manufacturing process's First Pass Yield?
Improving First Pass Yield involves several strategies:
- Implementing robust quality control measures at every stage of the production process
- Standardizing work instructions and providing clear documentation
- Investing in employee training to ensure adherence to quality standards
- Utilizing root cause analysis to identify and address recurring defects or errors
8. How can I enhance my Supplier Quality Incoming metric?
Improving Supplier Quality Incoming involves several steps:
- Establishing strong relationships with reliable suppliers
- Implementing supplier performance metrics to evaluate and compare suppliers
- Conducting regular supplier audits to ensure compliance with quality standards
- Collaborating with suppliers to resolve quality issues and drive continuous improvement
9. How do I increase my Customer Fill Rate?
To increase your Customer Fill Rate, you can:
- Optimize inventory management to ensure the right products are available when needed
- Streamline order processing to reduce delays and errors
- Enhance communication with customers to manage expectations and address issues promptly
- Implement advanced demand forecasting tools to better anticipate customer needs
10. What factors contribute to On-Time Delivery, and how can I improve it?
Factors that contribute to On-Time Delivery include demand forecasting, production efficiency, transportation routes, and order tracking. To improve On-Time Delivery, you can:
- Enhance demand forecasting accuracy to align production schedules with customer needs
- Optimize production processes to reduce lead times and improve efficiency
- Collaborate with logistics partners to identify and address transportation bottlenecks
- Implement real-time order tracking systems to monitor progress and proactively address potential delays
- Strengthen communication with customers to manage expectations and provide updates on delivery status

Rasheed Rabata
Is a solution and ROI-driven CTO, consultant, and system integrator with experience in deploying data integrations, Data Hubs, Master Data Management, Data Quality, and Data Warehousing solutions. He has a passion for solving complex data problems. His career experience showcases his drive to deliver software and timely solutions for business needs.